Another strong month in global equity markets. July saw a decisive turn in momentum from the first half of the year, with U.S. equities catching up to European stocks and the rest of the world. Geopolitics, valuations, and a labour update are on the docket, which means we are taking a little different approach to the format for this month. I’d call this a top-down pulse check as we progress into the second half of 2025.
Geopolitics
Trade deals roll in, or should I say the framework for the deals? We have yet to see the nitty-gritty details of many of these deals between the U.S. and other countries. I believe this speaks to the level of complexity behind global trade. To those who were beating the deglobalization drum earlier this year, I believe they will need to slow the beat to nearly a muffle. The U.S. cannot and does not want to stop trade – but they do have a mismatch in revenues and expenses, which they wish to address through a combination of tariff revenue, reallocated spending, and economic expansion. Our macro research partner, BCA Research, published the guide below on the U.S. trade negotiation tactics. Regardless of the path to get there, the speed and ability to reach agreements are positive.
World Markets 2025
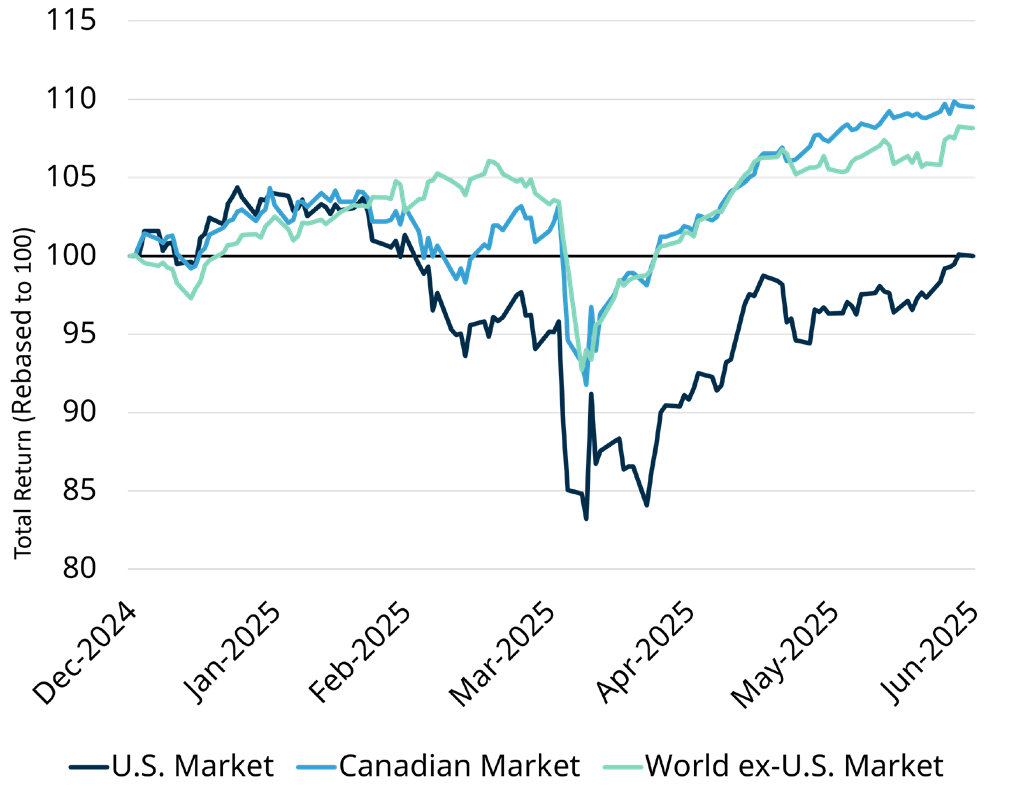
Source: FactSet Data & Analytics, Matco Financial Inc. as at July 31, 2025.

Source: BCA Research, Matco Financial Inc. as at July 24, 2025, https://www.bcaresearch.com/home
Valuation and the Bubbles
The rise of 2021 meme-like stock trading in the last six weeks has brought the topic of stock market bubbles back into focus. Fear of missing out, the greater fool theory and outright speculation are all cornerstones of past bubbles, but these concepts are extremely hard to measure in real time.
Those concerned about bubbles in the market typically point to valuations as one piece of evidence. It is extremely difficult to make an accurate call on bubbles. What I can say on the valuation front is that they have been steadily moving higher in 2025 – particularly in the U.S. However, we are largely where I would expect us to be given the level of fundamental performance in the last 3 years. Earnings have been trending higher and guidance for future quarters is rising – this type of fundamental momentum tends to attract a higher valuation.
A scatter plot of the relationship between trailing 12-month earnings growth in the U.S. and the price to earnings (valuation) at month end from January 2001 gives us a good sense of what other periods have looked like and where we sit today. I have adjusted the x and y axes to remove some of the largest outliers, but there are still some distinct periods that are of note. The largest oneyear earnings contractions tend to happen in periods of extreme economic stress like the Great Financial Crisis (GFC) or through the Covid shutdowns. Similarly, the largest periods of one-year earnings growth tend to happen as we rebound from said economic shock. As you can see, the rest of the periods cluster nicely between a -10% and 30% earnings growth and a valuation of 16-23x. With that said, June of 2025 saw 10% earnings growth in the last year and is parked at a little over 25x price to earnings meaning we are about where we should expect to be given the level of earnings growth and the rising guidance.
EPS Growth (1YR) vs Valuation
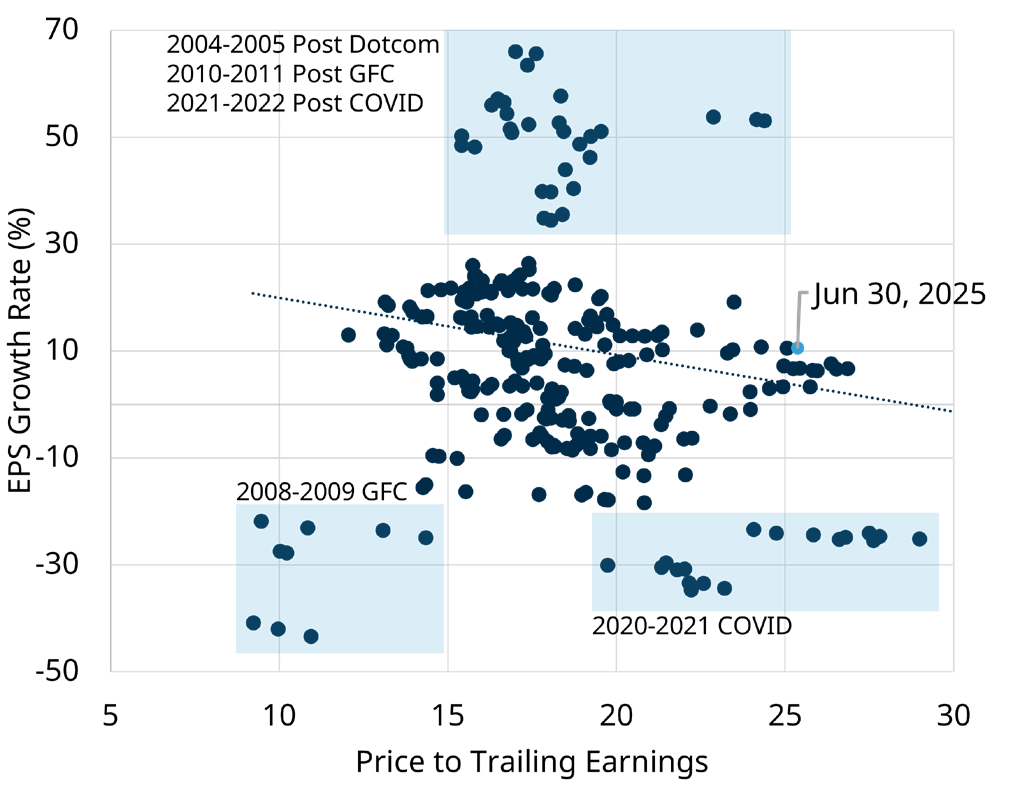
Source: Chart shows the Valuation on a trailing Price to Earnings basis vs the 1-year growth rate in EPS at month end from Jan 31, 2001 to Jun 30, 2025, Boxes identify outliers because of periods of stress or recovery in U.S. markets, FactSet Data and Analytics, U.S. Market represented by the FactSet U.S. Regional Index, Matco Financial Inc. as at July 25, 2025.
Said another way, looking solely at valuation doesn’t tell you the entire story. That’s why we choose to invest in a growth at a reasonable price framework. Growth? Where is it coming from, and what are its catalysts? Then what do we have to pay for the growth that we are expecting, and is that reasonable relative to other investments within the investment theme or sector.
The second quarter of the 2025 financial reporting season is moving along with around 30% of U.S. large-cap stocks slated to report the week of Jul 27th. The reports have been strong, beating expectations and showing a better earnings growth level than what was expected. Both the technology and financial services have shown good fundamental performance. We will get more details on the health of the consumer in mid to late August, with companies like Walmart and Home Depot reporting.
In addressing the higher valuations at a regional level, it is also important to consider the levels of profitability we are seeing in the market today. Operating margins in the U.S. are strong. At the end of June, we have seen 14% or better operating margins for 11 months in a row, the best streak on record according to FactSet data. Other developed markets are trailing the U.S. by nearly 4%. This difference in profitability lures investors in explaining why the U.S. market is so large and why we see the consistent valuation premium.
Operating Margin
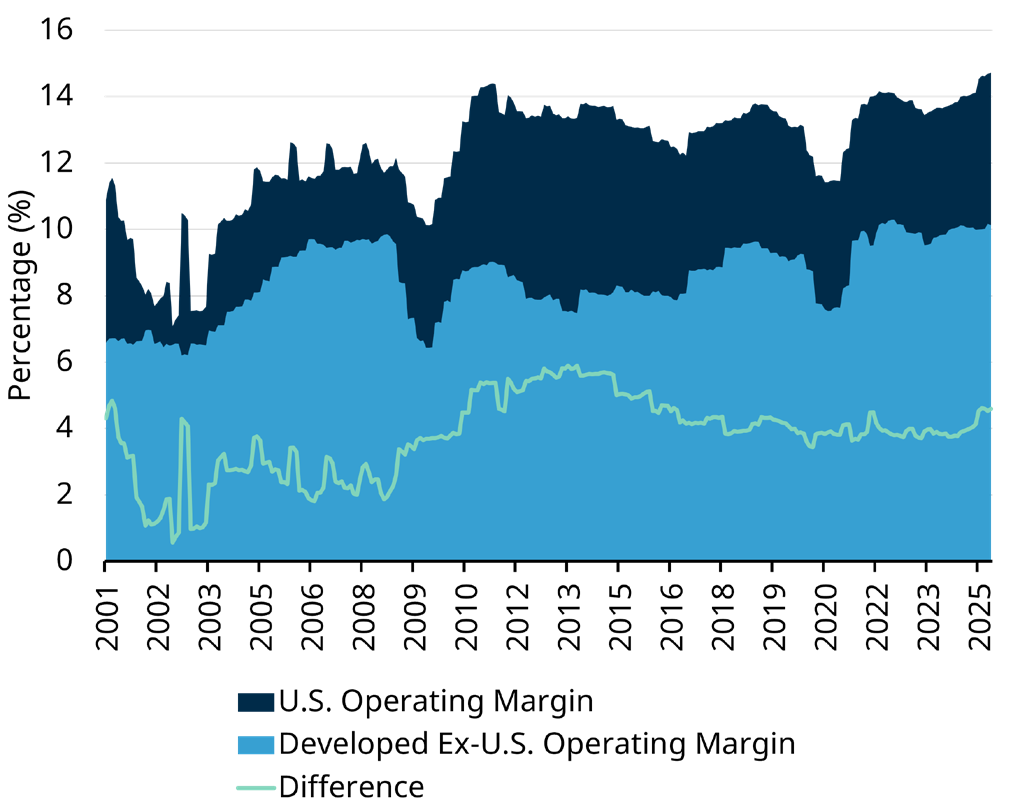
Source: Chart shows the Operating margin defined as EBIT as a percentage of Revenue over time, U.S. market represented by the FactSet U.S. Country Index, Developed Ex-U.S. represented by the FactSet Developed Ex-U.S. regional Index, FactSet Data and Analytics, Matco Financial Inc. as at July 25, 2025.
Labour Update
An update on the labour market since I last spoke about it in the first quarter – so far, so good. The trend in initial unemployment claims and continuing claims continues to follow its post-covid cycle, and the absolute level of employment in the U.S. continues to be healthy. Using the stop light analogy, a light green. The July employment numbers out the week of July 28th will provide additional colour to the current situation and the impacts of tariffs. However, like most things, the seasonality does play a role, and I would expect that September or December this year will bring a lot more speculation around the health of the labour market.
Level: 4 Week Avg Leading Jobs Data
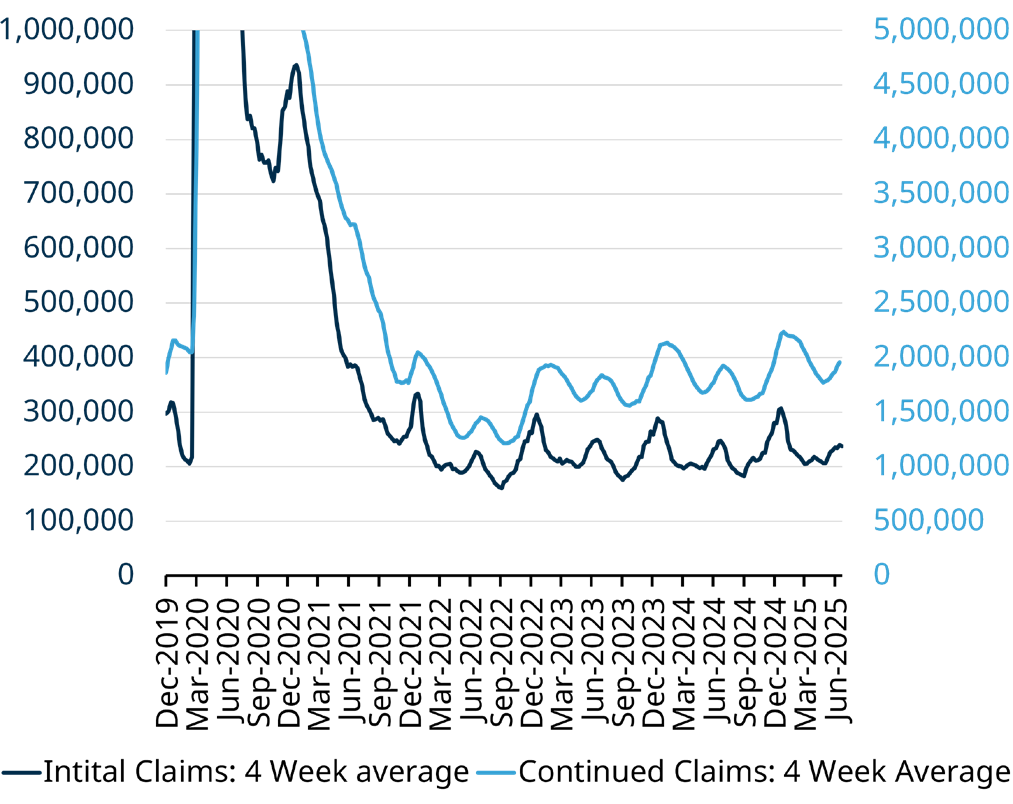
Source: U.S. Employment and Training Administration, Initial Claims [ICNSA], and Continuing Claims [CCNSA], retrieved from FRED, Federal Reserve Bank of St. Louis, Matco Financial Inc. as at July 25, 2025
Week Over Week Change: Leading Jobs Data
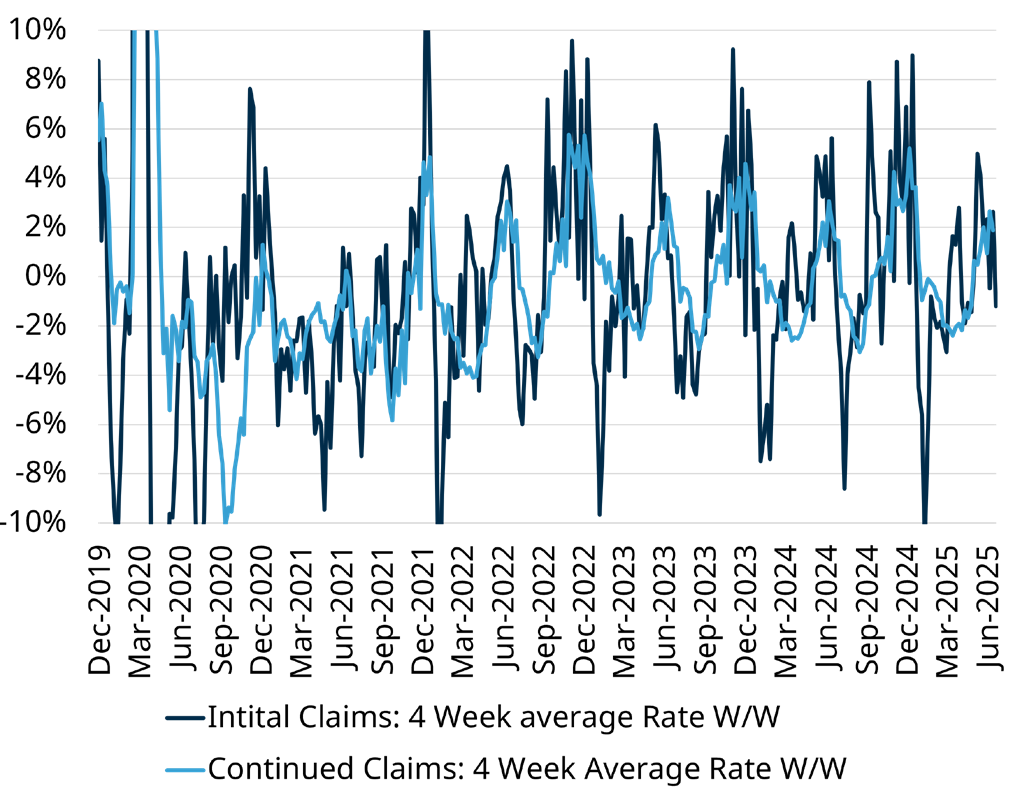
Source: U.S. Employment and Training Administration, Initial Claims [ICNSA], and Continuing Claims [CCNSA], retrieved from FRED, Federal Reserve Bank of St. Louis, Matco Financial Inc. as at July 25, 2025
Bottom Line
As I said at the start, I took a top-down perspective this month. The pulse check is good. Slightly elevated valuations are something to be aware of, but not a point of panic. The pace and number of trade deals have been a positive development. The labour market in one of the largest economies in the world, the U.S., appears to still be intact.
It’s 2025, so here is the comment on artificial intelligence. The continued spending to build out data centers and the development of tools to apply AI and robotics to real-life problems is a tremendous opportunity. Our positioning within technology has looked to balance the buildout of infrastructure with the operators that can deliver solutions to real-life problems, and given what we have seen this year we do not believe we need to change course today. To a degree, the higher valuations are a result of this investment theme, and we are comfortable with that as the companies have so far shown some impressive results.