
Following the Money
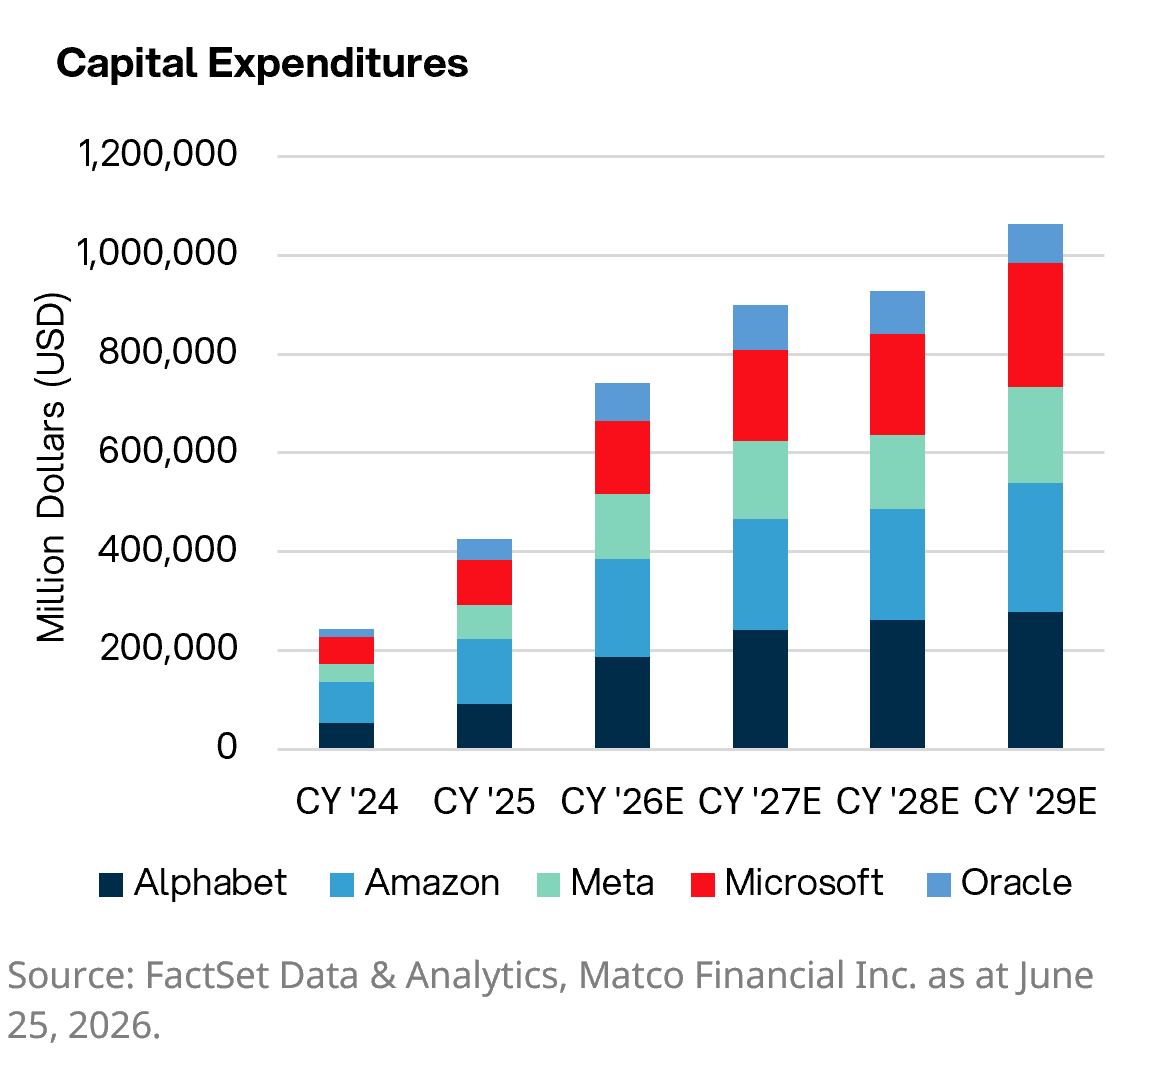
Last July, I wrote about the R&D & Capex iceberg, the enormous technology spending happening below the surface of reported earnings. I want to come back to that, because the number has only gotten bigger, and a question has come with it. Street estimates according to FactSet now put 2026 capital spending by the five largest(1) AI infrastructure spenders at $741 billion. That figure was $425 billion at the end of 2025. So, in the span of one year, the ramp in spending is expected to nearly double from the previous year.
That is a staggering amount of money. And most of the commentary you will read stops right there, at the size of it.
With AI Infrastructure spending expected to continue into 2030, I want to ask the harder question.
Somebody, eventually, has to earn a return on that $741 billion. The companies pouring concrete and buying chips are not building data centers as a charity. They are building them on the bet that other businesses will use these tools to make more money. Enough to justify the bill. To date, this race was about who could build the fastest. The next year is about something quieter, and in my view more important: whether any of it actually shows up in the numbers.
So here is the question I am bringing into 2027, and the one I will be using to sort through this theme all year.
The question of who is building AI is largely answered. The harder one, the question worth your attention now, is who can turn it into margin expansion.
That is a question you can actually watch happen. It shows up in quarterly results. It shows up in operating margins and cash flow. You do not need a forecast to track it, you need to know where to look. Let me show you where I am looking.
Where The Money Goes First
In the early innings of any spending cycle, the market pays the builders. When the spending is on chips and data centers, the first winners are the company’s selling chips and leasing data center space. That is where we have been, and the spending is real. Microsoft reported $31.9 billion of capital expenditures in a single quarter, with roughly two-thirds of it going to short-lived assets like GPUs that will need replacing. Alphabet guided to $180–190 billion for the full year. Amazon's trailing free cash flow fell to $1.2 billion, dragged down by a $59 billion year-over-year jump in property and equipment, most of it AI.
These are the builders being paid. I have no argument with it. Using the stoplight, the build-out is still a green light.
But here is what happens next, and it happens in every cycle I have studied. Once the building is well underway, the market stops asking "who is selling the shovels?" and starts asking "is anyone striking gold?" The spending becomes the assumption. The return becomes the question.
We are approaching that turn now.
The Part Almost Nobody Is Pricing
This is where it gets interesting, and where I think the homework pays off. McKinsey's latest survey found that 88% of companies now use AI in at least one part of the business, up from 78% a year ago(2). That sounds like the story is over—almost everyone is using it. But read one line further. Only about a third say they have actually scaled it. The rest are experimenting.
Sit with that gap for a second. Nearly everyone is dabbling. Almost no one has industrialized it. That gap is the whole opportunity, because the market is currently paying for the dabbling and has not yet figured out who will do the industrializing. And here is the number that made me want to write this. You do not need a company to reinvent itself for this to matter. Take a business running a 5% operating margin. Move it to 6%. In plain terms that sounds like one percentage point, a rounding error. In economic terms it is a 20% increase in operating profit. One point of margin. Twenty percent more earnings.
That is the lever. So, the real work is figuring out where that point of margin is hiding. It is an efficiency game.
Where A Point of Margin Is Actually Hiding
So where do you go looking for that point? You go where there is a lot of humans, repetitive, judgment-heavy work sitting inside the cost base, because that is what these tools are genuinely good at compressing.
That points straight at consumer-facing businesses. Large store networks. Customer service teams. Returns. Inventory decisions. Scheduling labor against demand. Last quarter we talked about how these business-to-consumer companies struggled to pass tariff costs through. Walmart took margin compression because it could not raise prices fast enough. That pressure is exactly why they are worth watching now. When you cannot raise the price, the only lever left is productivity.
Walmart is already showing what it looks like when the lever works. More than 60% of its U.S. stores now receive freight from automated distribution centers. More than half of its e-commerce fulfillment volume is automated. The company says this is lowering its cost to serve. In the most recent quarter, U.S. e-commerce grew 26% while store-fulfilled delivery more than doubled over two years.
That is the evidence I am after. A CEO can say "AI" forty times on an earnings call, and it tells me nothing. What tells me something is a number that lands on the income statement—a cost to serve that fell, a margin that moved, a dollar of revenue that took less labor to earn.
The first screen I run is simple: where could AI actually change the numbers?
How We Are Positioned
Inside the Matco Global Equity Fund, none of this changes our framework. We want wide-moat businesses, growing cash flows, and management teams with a track record of actually executing on the technology they buy. Growth matters, and the price we pay for that growth matters just as much. The question above leaves that framework untouched. What it changes is the homework. We are now looking across the AI theme in three places at once, and weighing each one differently.
Fortinet Inc: A cyber security business that develops and sells security products including firewalls, endpoint security and intrusion detection systems. They directly enable business’ to safeguard their data and support the move from AI experimentation to AI integration. Their Sales are expected to be 20% higher and earnings are expected to be 25% higher than a year ago(3).
Meta Platforms: A digital ad platform known for Facebook and Instagram, Meta is typically framed as an AI builder these days; however, the steps they are taking to adopt AI in their core business is moving the dial on margins. Operating margins have been in the 40% range since Q3 of 2023. Their adoption of AI into their platform has supported higher user engagement and significant increases in advertising revenue due to the targeted nature of their ad platform. Sales are expected to grow by 26% verse the previous year, while earnings are expected to expand by 40%(4).
The Bottom Line
The first leg of this race rewarded the companies that built the tools. The next leg may reward the companies that use them well, and that is a quieter, slower story that shows up one margin point at a time.
So, the question I will carry through every quarter this year is the one I started with. Who is spending the most on AI matters less now than whose income statement is quietly getting better
because of it. That is something you can watch, company by company, quarter by quarter.
And somewhere out past all of this sits a third possibility worth keeping in the back of your mind. The biggest winners of past technology cycles were often businesses that did not exist when the cycle began. The internet did more than make old companies efficient. It eventually created companies that could not have existed before it. AI will likely do the same, and those names are not on anyone's screen yet, including mine. That is a story for another year.
For now, the rational path is the one we have always taken. Follow the money first, then follow the margin. The spending tells you where the race started. The margins will tell you who is actually winning it.
References
- Capital Expenditure for calendar year 2026 are based on the total of Alphabet, Amazon, Meta, Microsoft, and Oracle. Source: FactSet Data and Analytics and Matco Financial, June 25, 2026.
- McKinsey & Company, The state of AI in 2025: Agents, innovation, and transformation, November 5, 2025.
- Based on next twelve-month Sales and earnings mean estimates. FactSet Data and Analytics, Matco Financial, June 25, 2026.
- Based on Calendar Year 2026 mean estimate for revenue and earnings. FactSet Data and Analytics, Matco Financial, June 25, 2026
Disclaimer
Matco Financial is an independent, privately held discretionary investment counsellor & asset management firm that serves the needs of individual investors, institutions, advisors, trusts, corporations and not-for-profit organizations.
Matco provides investment advisory services to investors on a discretionary basis through mutual funds and separately managed accounts. This communication is intended for information purposes only and does not constitute an offer or solicitation by anyone in any jurisdiction in which such an offer or solicitation is not authorized or to any person to whom it is unlawful to make such and offer or solicitation.
All statements that look forward in time or include anything other than historical information are subject to risks and uncertainties and are not guarantees of future performance. Investors should not rely on forward looking statements. Actual results, actions or events, could differ materially from those set forth in the forward looking statements.
Where the Net Asset Value ("NAV") price or performance of a particular series of a fund is displayed, other series are available; and fees, NAV price and performance may differ in those other series.
Performance returns for the Matco Mutual Funds are calculated by Matco Financial Inc. These returns are calculated and reported in Canadian dollars and are historical simple returns for the 3 month, YTD and 1 year periods and annualized compounded total returns for periods after 1 year. They include changes in unit value and reinvestment of all distributions and do not take into account sales, redemption, distribution or optional charges or income taxes payable by any security holder that would have reduced returns. Matco Fund returns for Series F units are calculated after management fees and operating expenses have been deducted. Matco Fund returns for the Series O units are calculated after operating expenses have been deducted. Series O unit management fees are charged separately outside of the fund. Matco Fund returns are calculated after management fees and operating expenses have been deducted. In comparison, the index returns do not incur management fees or operating expenses. Index returns are supplied by a third party. We believe the data to be accurate, however, we cannot guarantee its accuracy.
Commissions, trailing commissions, management fees, brokerage fees and expenses all may be associated with mutual fund investments. Please read the Fund Facts and Prospectus before investing. Mutual funds are not guaranteed, their values change frequently, and past performance is not indicative of future performance. Matco Funds are not available for purchase in Quebec, Newfoundland & Labrador, PEI, New Brunswick or the Territories.